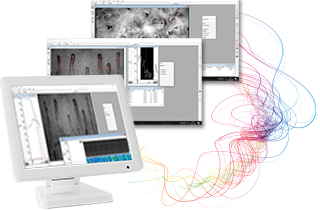
Capillary analysis software
Product nameCapimetrics (Capillary metrics)
- *Filming in AVI format is possible with the notebook computer included in the research set.
- *An automatic movement correction function is included to reduce minor blurring.
About the capillary analysis software
-
Loading of video
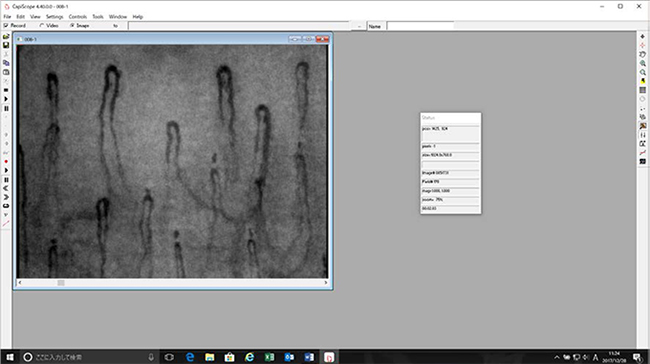
The analysis software allows videos taken with the research set (in AVI format) to be analyzed. Load the video you want to analyze.

-
Image adjustment
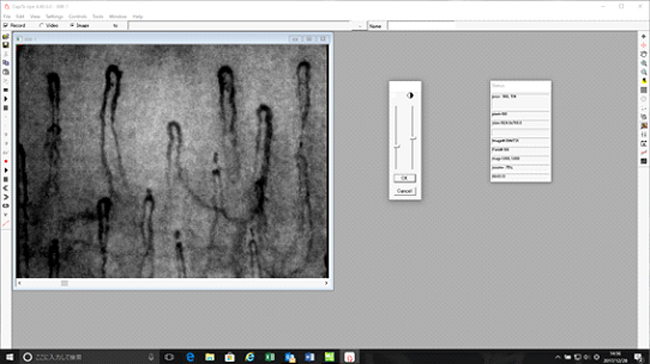
The loaded video is binarized, and the brightness and contrast of the input can be adjusted with the slide bars on the screen.

-
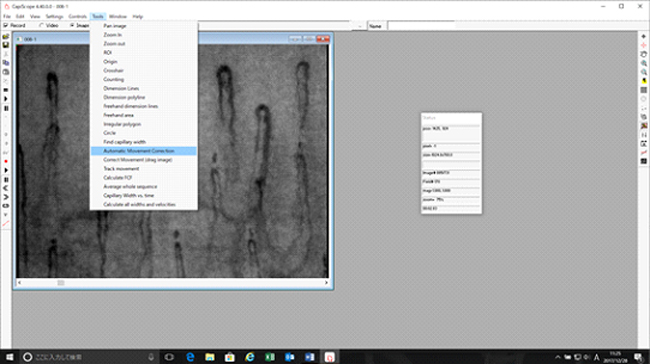
Automatic Movement Correction function
When filming videos, there is almost always some blurring. Accurate measurements cannot be made even if there is almost no blurring. This function allows this subtle blurring to be properly corrected.

-
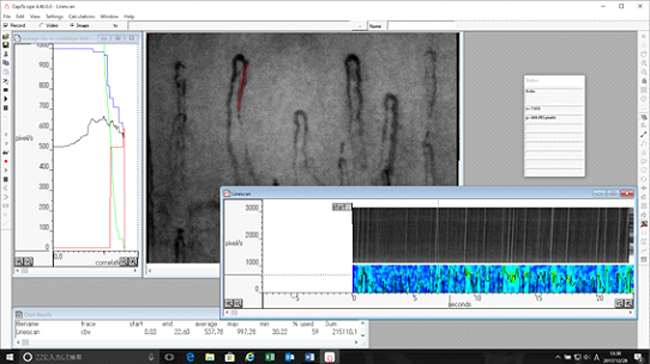
Flow velocity measurement
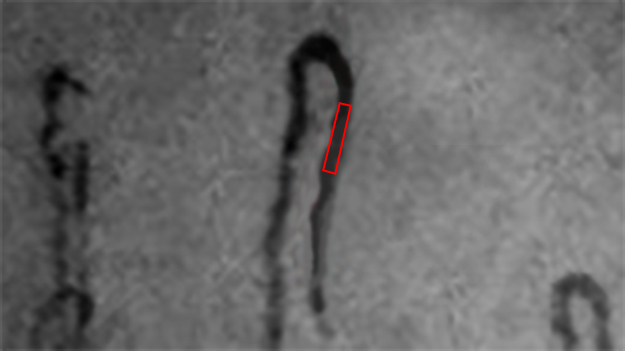
The flow velocity is measured by drawing a rectangle along the blood vessel with the mouse. Measurement is possible regardless of the angle of the blood vessel, even if it is non-linear. (However, the more linear the section, the better the measurement results.) Adjust of the blood vessel width according to the thickness of the blood vessel. The flow velocity reflected as the average of the entire blood vessel is measured by adjusting so as to cover the entire blood vessel. At this time, the 3D image is replaced with a 2D image. (The thicker the blood vessel, the darker the image.) There are two ways to measure the flow velocity with this software, as described below.
-
*Temporal Correlation
The velocity is found by creating a window with the cursor at two points on a blood vessel running parallel to the skin, finding the change in brightness when blood cells pass through this window, calculating the time difference T of the change pattern, then determining the velocity with the distance L between the two points. Velocity = L (distance)/T (time difference)
-
*Spatial Correlation
This calculation method is set by default. The blood vessel is surrounded by lines, and changes in the gray level within this area are captured at a rate of 1/60 seconds with normal video frames. The correlation functions of the varying gray levels are deduced and compared. Because the distance of the blood cells shown between the gray level images is already known, the velocity is easily calculated. The velocity is displayed as the average speed and the maximum speed.

Enlarged view

-
-
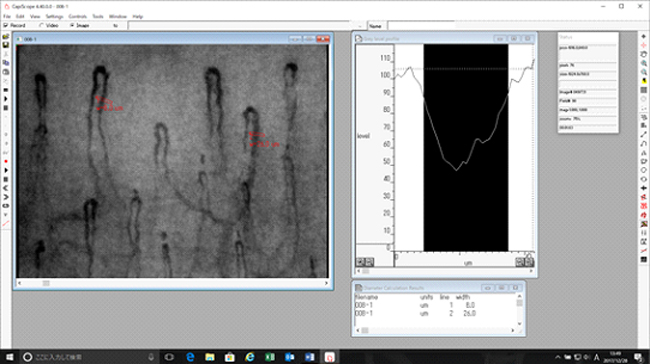
Measurement of blood vessel diameter
Draw a line perpendicular to the blood vessel. Draw the line in such a way that the entire diameter blood vessel is covered. The diameter is averaged according to the gray level. The detected diameter is shown by the gray level and the calculated diameter is displayed.

-
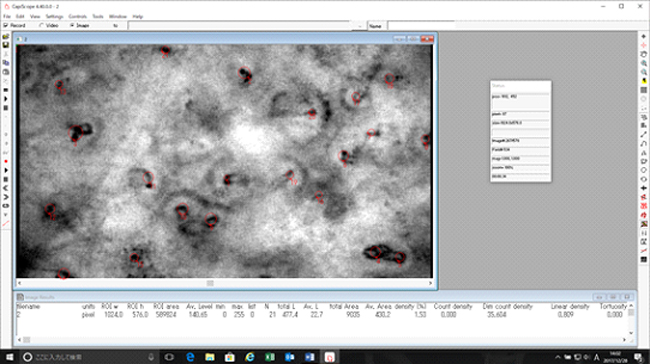
ROI (density measurement)
Marking is performed manually after automatic hand shaking correction. (There is also an automatic blood vessel recognition function, but because noise is also read, manual correction is necessary.) Click = on the screen to calculate the blood vessel density automatically.

-
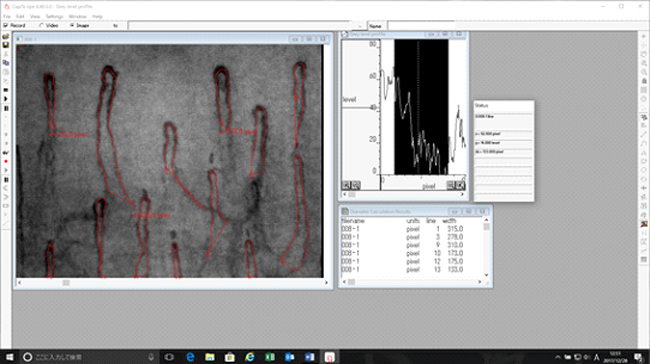
Blood vessel length measurement
Trace the blood vessels you want to measure. The length of each blood vessel that was traced can be measured.

Analysis evaluation services (Before & After analysis evaluation)
As of October 2018 Capillary Study Society, an incorporated NPO
-
Case 1
Nail contour Evaluation within 1 to 3 days (when there is no change in blood vessel shape, etc.)
1. Blood flow velocity / 2. Blood vessel thickness / 3. Evaluation and comments by a physician -
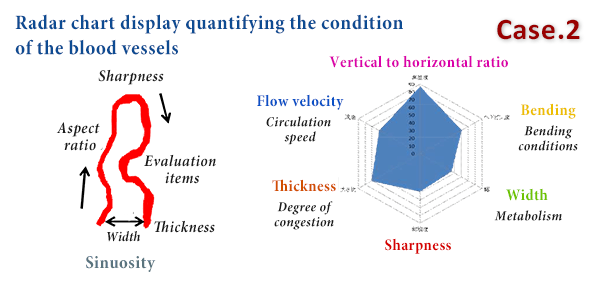
Case 2
Nail contour Evaluation after 2 weeks or more have passed (when there are changes in blood vessel shape, etc.)
1. Blood flow velocity / 2. Blood vessel thickness ratio / 3. Blood vessel aspect ratio / 4. Sinuosity / 5. Distance between artery side and vein / 6. Sharpness / 7. Evaluation and comments by physician * Radar chart display quantifying the condition of the blood vessels -
Case 3
Skin <Any period>
1. Blood vessel density / 2. Evaluation and comments by a physician
* The analysis evaluation version may be upgraded.


